
Summary
ITC Ltd, one of India’s leading conglomerates, operates in various sectors such as FMCG, hotels, paperboards, and more. This blog aims to provide a detailed fundamental analysis of ITC Ltd’s stock, helping investors make informed decisions. Download our comprehensive Free Excel sheet for an in-depth look at ITC Ltd’s financials.

Balance Sheet
The balance sheet is a snapshot of ITC Ltd’s financial health at a specific point in time. It highlights the company’s assets, liabilities, and shareholders’ equity, providing insight into its liquidity and capital structure. Analyzing the balance sheet helps investors understand how well ITC Ltd can meet its short-term obligations and fund its operations.
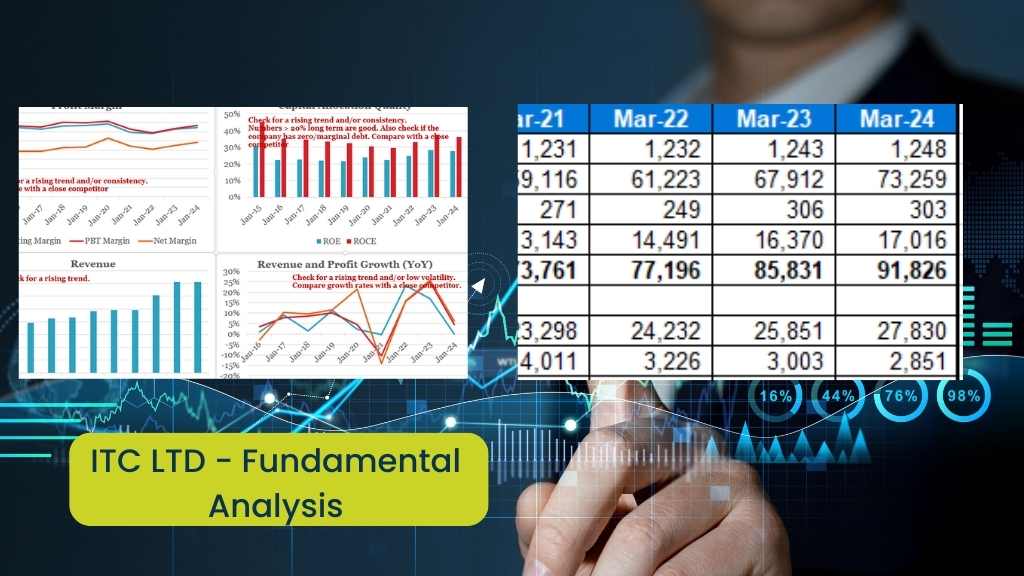
Profit & Loss
The profit and loss statement (P&L) reflects ITC Ltd’s revenues, expenses, and profits over a period. It indicates how well the company generates profit from its operations. Key metrics to watch include revenue growth, operating margins, and net profit margins, which help gauge operational efficiency and profitability.
Cash Flow
Cash flow analysis is crucial as it shows the actual cash generated or used by ITC Ltd. Positive cash flow indicates a company’s ability to expand operations, pay dividends, and reduce debt. Pay close attention to operating cash flow, investing cash flow, and financing cash flow to understand the company’s liquidity and financial stability.
Expected Return
Calculating the expected return involves assessing the potential profitability of investing in ITC Ltd’s stock. This can be estimated using the Capital Asset Pricing Model (CAPM), which considers the stock’s volatility relative to the market. Expected returns help investors make projections about future performance and set realistic investment goals.
Key Ratios
Essential financial ratios for ITC Ltd include:
Price-to-Earnings (P/E) Ratio: Indicates how much investors are willing to pay per rupee of earnings.
Debt-to-Equity Ratio: Measures financial leverage and the company’s reliance on debt.
Return on Equity (ROE): Shows profitability relative to shareholders’ equity.
Current Ratio: Assesses short-term liquidity.
Chart
Charts play a pivotal role in visualizing ITC Ltd’s historical performance and identifying trends. Use charts to track stock price movements, trading volume, and technical indicators over various time frames.
Common Size Analysis
Common size analysis involves expressing each item on the financial statements as a percentage of a base amount. This method allows for easy comparison across periods and with other companies, highlighting changes in ITC Ltd’s financial structure and performance.
Data Sheet
Our downloadable Excel sheet includes detailed financial data such as income statements, balance sheets, cash flow statements, and key financial ratios. It provides a structured format to analyze and interpret ITC Ltd’s financial health.
Quarters
Quarterly performance analysis is crucial for understanding ITC Ltd’s short-term trends and cyclicality. Examining quarterly reports reveals how the company performs in different economic conditions and seasons.
Intrinsic Values
Intrinsic value represents the true worth of ITC Ltd’s stock based on fundamental analysis. Calculation methods include:
Dhandho Intrinsic Value:
Focuses on a conservative estimate using low-risk principles.
Ben Graham Formula:
A valuation formula developed by Benjamin Graham to determine a stock’s fair value.
Discounted Cash Flow Valuation (DCF):
Projects future cash flows and discounts them to their present value.
Importance of Fundamental Analysis
Fundamental analysis is essential for making informed investment decisions in the stock market. It involves evaluating a company’s financial health, performance, and potential for future growth, providing a solid foundation for investing in ITC Ltd and other stocks.
Conclusion
Conducting a thorough fundamental analysis of ITC Ltd helps investors understand its financial position and make well-informed investment choices. Utilize our free Excel sheet for a comprehensive evaluation, and stay updated on market trends.
Download Excel Sheet
FAQ’s
What is fundamental analysis in the stock market?
Fundamental analysis involves evaluating a company’s financial statements, performance metrics, and market position to determine its intrinsic value.
How can I calculate the intrinsic value of ITC Ltd’s stock?
Intrinsic value can be calculated using methods such as the Dhandho Intrinsic Value, Ben Graham Formula, and Discounted Cash Flow Valuation.
Why is cash flow analysis important for ITC Ltd?
Cash flow analysis is crucial as it shows the actual cash available for operations, expansion, and paying dividends, indicating the company’s financial health and stability.